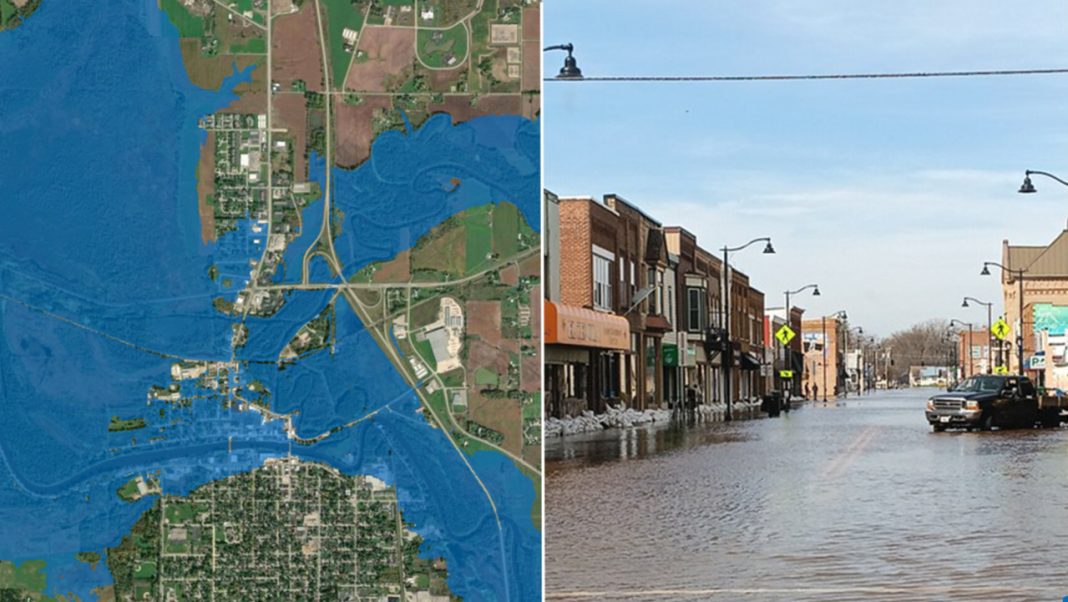

River flooding can turn familiar streets, roads, and neighborhoods into dangerous waterways with little warning. A new mapping tool from the National Oceanic and Atmospheric Administration (NOAA) aims to help people understand where floodwaters could spread before conditions become critical. With coverage now reaching nearly the entire U.S. population, the tool offers valuable insights for residents, emergency responders, and local officials preparing for potential floods.
NOAA’s Flood Mapping Tool Now Covers Nearly the Entire U.S. Population
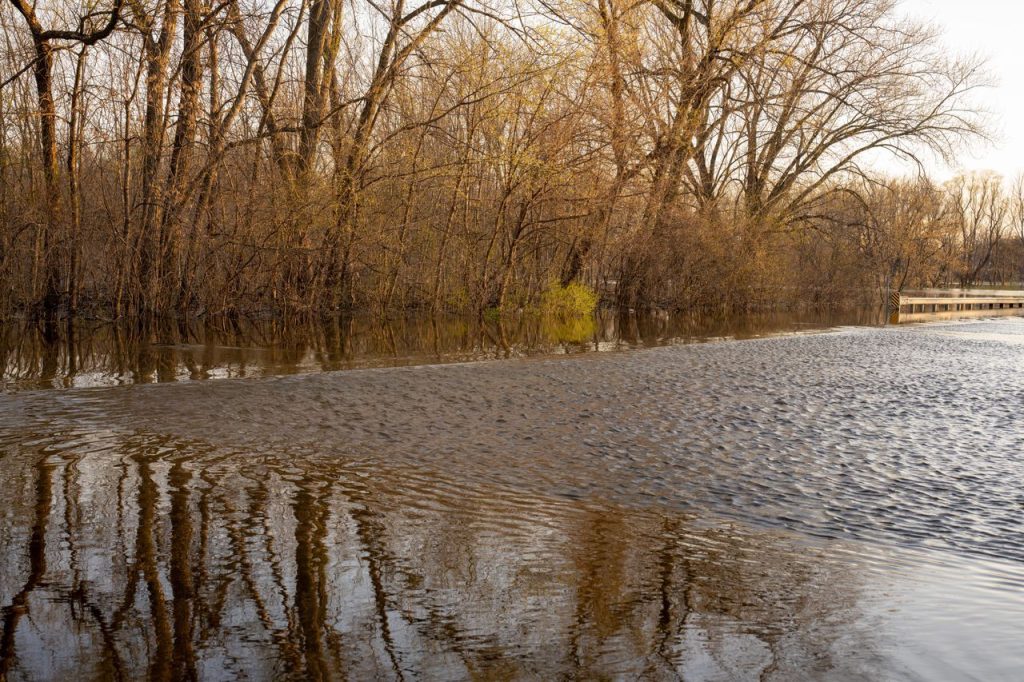
Knowing that a river may flood is one thing, but understanding which nearby areas could end up underwater is another. The National Oceanic and Atmospheric Administration (NOAA) has expanded its experimental Flood Inundation Mapping (FIM) service to reach nearly 100% of the U.S. population, a major increase from its previous coverage of about 60%. The tool estimates where floodwaters may spread by combining river flow forecasts with current conditions. This gives residents, weather forecasters and emergency managers a clearer picture of potential flooding in the days ahead. Although the expanded coverage is a significant step forward, it does not mean every community is fully covered. Portions of northern and western Alaska, Guam, the Northern Mariana Islands and American Samoa remain outside the current service area.
The Maps Reveal Potential Flooding at the Neighborhood Level
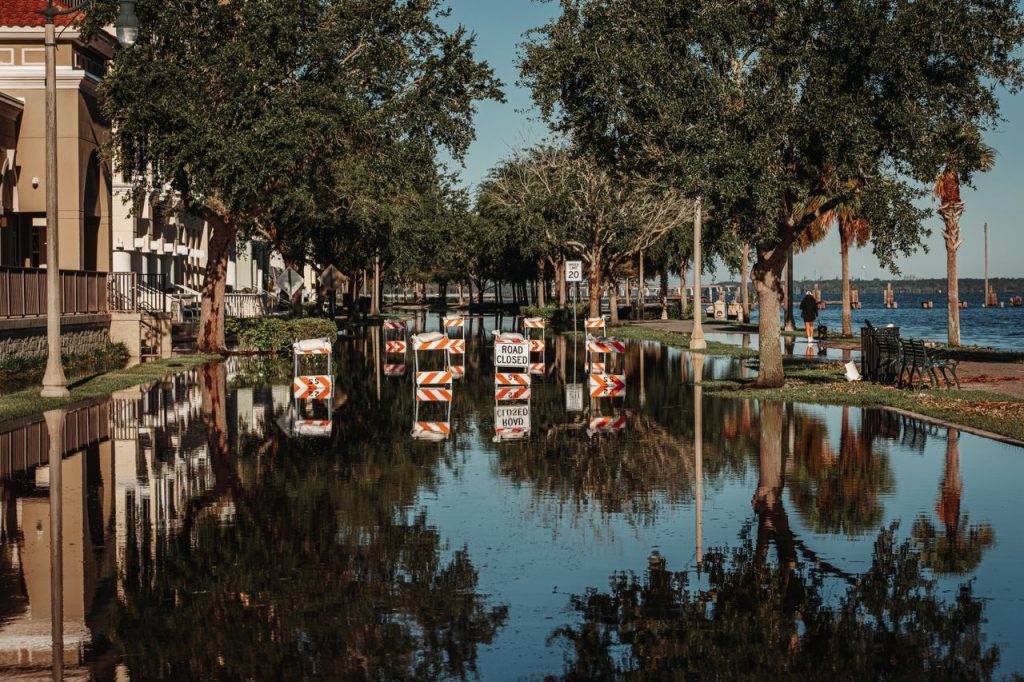
A river forecast can warn people that water levels are rising, but it may not show how far the water could travel beyond the riverbanks. NOAA’s Flood Inundation Mapping service helps fill that gap by illustrating the estimated areas that could become submerged during a flooding event. The maps cover approximately 3.3 million miles of rivers and streams across the continental United States, U.S. territories and Hawaii. This level of detail can help people understand whether nearby roads, homes, public facilities or other important locations could be affected. For emergency officials, seeing the potential extent of flooding can make it easier to identify vulnerable areas and communicate risks to the public. However, these maps represent modeled estimates rather than guarantees of exactly where water will reach, so they should be considered alongside official flood warnings and local emergency guidance.
River Flow Forecasts Help Predict Where Floodwaters Could Spread
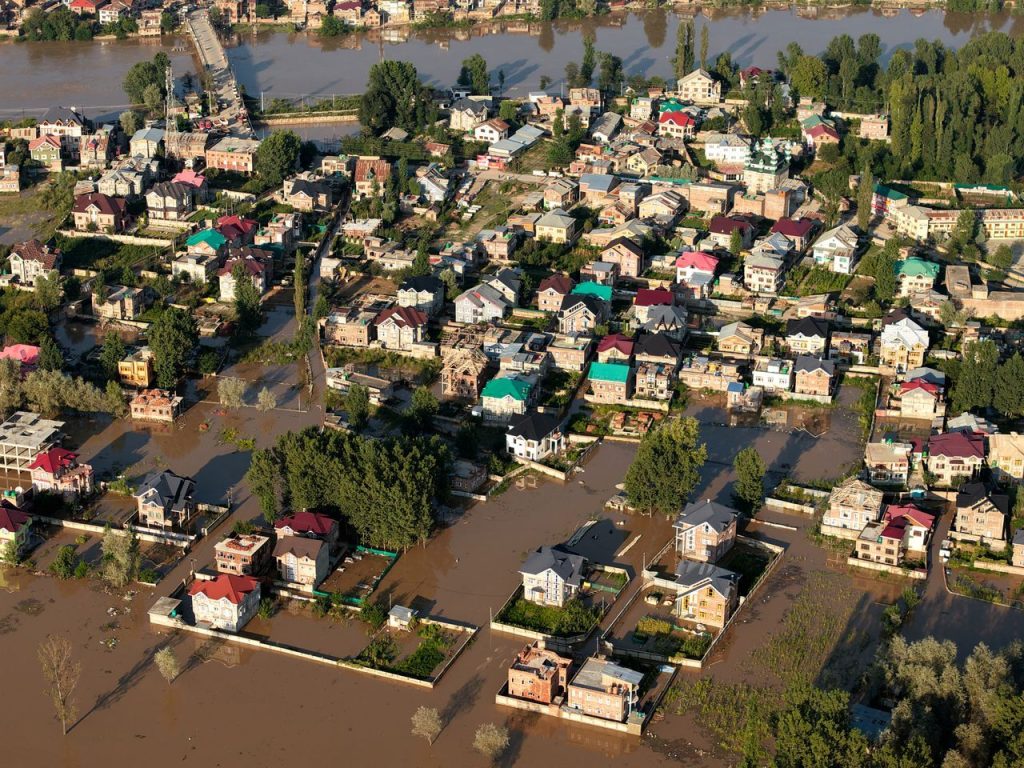
Flooding does not depend on river height alone. The amount of water flowing downstream, recent weather conditions and the surrounding landscape can all influence which areas may become submerged. NOAA’s FIM service uses information from the National Water Model and forecasts from National Weather Service River Forecast Centers to estimate potential inundation. By translating predicted river flows into mapped areas of possible flooding, the system helps turn complex water forecasts into information that is easier to understand. Some versions show current conditions, while others estimate where floodwaters may spread over the coming days. These forecasts can help emergency managers prepare resources, assess vulnerable locations and determine whether protective measures may be necessary. Because river conditions can change as rainfall and other factors evolve, the maps should be checked regularly rather than treated as a fixed prediction.
The Latest Expansion Adds Coverage Across Several Major Regions
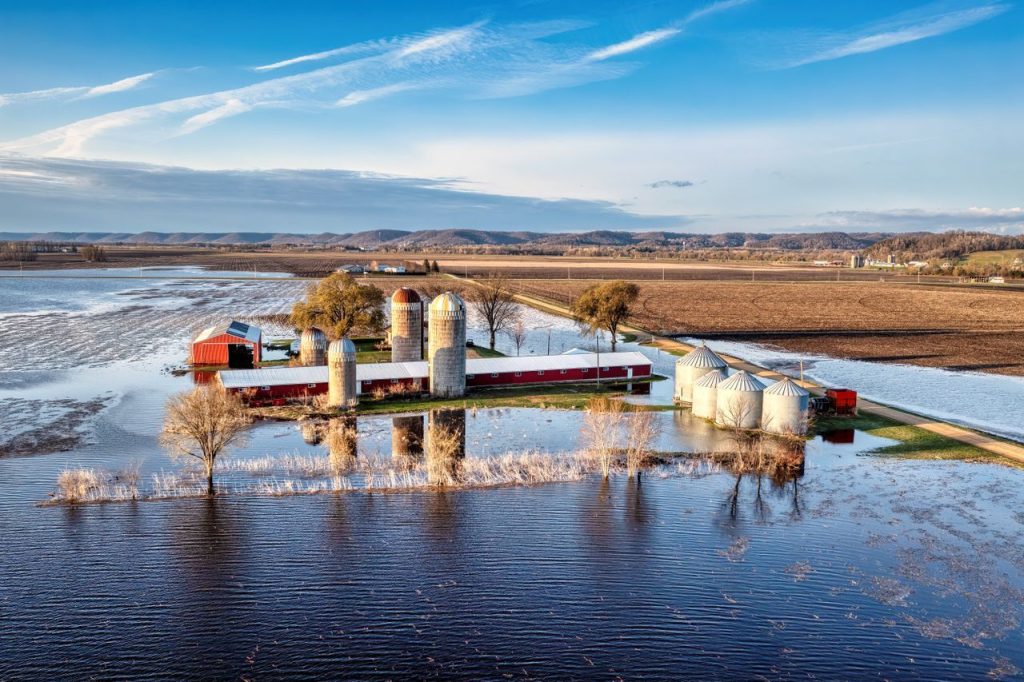
The expansion brings flood mapping information to communities across a broad range of U.S. landscapes. NOAA’s latest rollout includes new coverage for the southeastern U.S. coast and Florida, the Great Lakes region, New England, the Rocky Mountains, the Dakotas and western Nebraska. These areas have different geographic features and weather patterns, which can influence how rivers respond to heavy rainfall, snowmelt and other sources of excess water. Extending the service across these regions means more people can access mapped estimates of potential river flooding instead of relying solely on river level forecasts. The broader reach also gives emergency planners additional information to consider when preparing for dangerous weather. However, coverage does not mean every river or location has identical forecasting capabilities. Available products vary by region, and some areas have different forecast periods or rely on selected river forecast points.
Emergency Officials Have Used the Maps to Support Evacuations
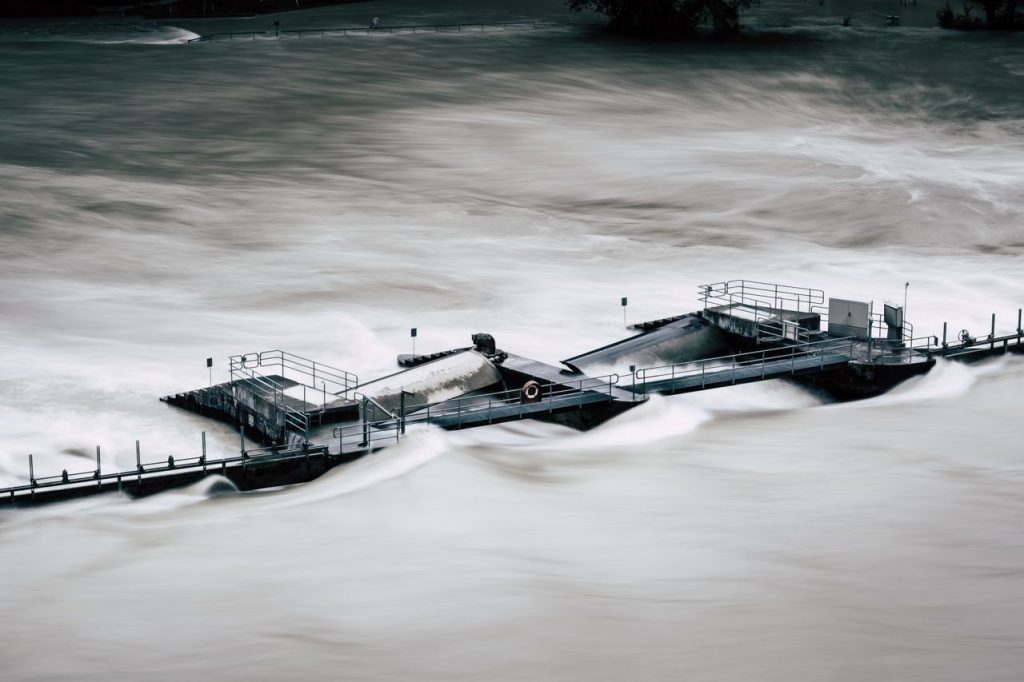
The value of a flood map becomes especially clear when emergency teams need to make decisions before water reaches homes or critical facilities. NOAA’s National Weather Service has reported several cases in which FIM information helped local officials understand potential flood impacts and respond sooner. In spring 2025, the Nashville weather office used the maps to help a senior assisted-living facility in Macon County, Tennessee, plan a safe evacuation before floodwaters reached the building. In April 2025, the Little Rock office shared the information with the city of Hardy, Arkansas, where officials went door to door to evacuate residents. The maps have also supported decisions involving road closures and evacuations in Texas and helped officials prepare for rising water in Oklahoma. These examples show how visual flood forecasts can support time-sensitive decisions, although they do not eliminate the need for local assessments, emergency planning or official warnings.
Different Map Versions Offer Forecasts With Important Limitations

NOAA provides several versions of its Flood Inundation Mapping service, allowing users to examine current conditions or look ahead to possible flooding. In the Lower 48 states and parts of south-central Alaska, available products include an hourly analysis of current conditions, a five-day forecast based on the National Water Model, a five-day forecast from National Weather Service River Forecast Centers and static categorical maps for selected river forecast points. In Hawaii, Puerto Rico and the U.S. Virgin Islands, the available options include hourly current-condition analyses, 48-hour forecasts and static maps for selected gauged locations. These differences matter because the forecast period and level of detail depend on the product and location. The service remains experimental, and NOAA is seeking feedback to improve it. People can access the maps through the National Water Prediction Service website and supported geographic information system applications. For decisions involving immediate danger, users should still follow official alerts and instructions from local emergency authorities.