
Flood forecasting is no longer confined to a river crest number on a chart. NOAA now offers a far more visual answer to a pressing public question: not just how high the water may rise, but where it is likely to go.
That shift matters because flood risk is experienced street by street, not county by county. With NOAA’s Flood Inundation Mapping now covering nearly 100% of the U.S. population on an experimental basis, the agency has moved closer to turning flood prediction into a practical map for everyday decisions.
Why NOAA’s flood map expansion matters
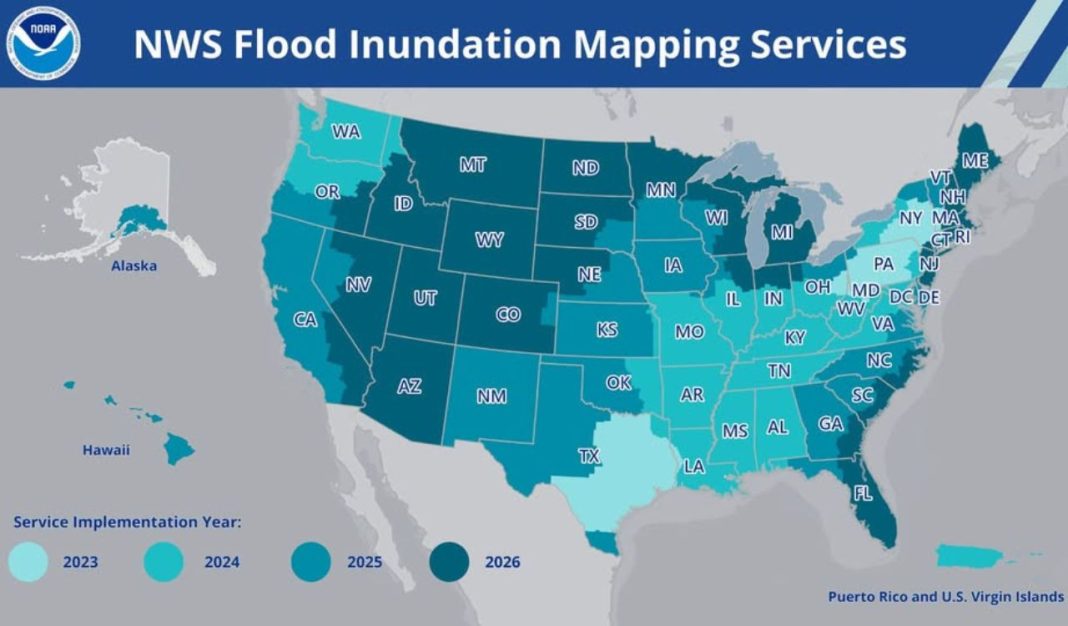
NOAA announced on September 24, 2026 that its National Weather Service Flood Inundation Mapping, or FIM, tool is now available on an experimental basis to nearly 100% of the U.S. population. That is a dramatic jump from the roughly 60% population coverage the system had reached in 2025, and an even larger leap from its 2023 launch, when it covered about 10% of Americans. According to NOAA, the tool now depicts flooding potential along 3.3 million river miles across the continental United States, Hawaii, and U.S. territories, marking one of the agency’s most consequential recent expansions in public-facing water prediction.
The significance of that increase is not merely geographic. Traditional flood information often tells users whether a river is expected to reach minor, moderate, or major flood stage, but such categories can be abstract for residents trying to decide whether a road, home, care facility, or business district is at risk. Flood inundation maps translate projected river conditions into spatial estimates of land area likely to be covered by water in the following hours or days. In effect, they convert hydrologic forecasting into a neighborhood-scale planning tool.
NOAA’s own language emphasizes that point. The agency says the maps are intended not only for forecasters and emergency managers, but also for the public. Neil Jacobs, NOAA’s administrator, described inundation maps as critical for assessing flood impacts and said the expansion was designed to ensure that nearly every American can access detailed information beyond an expected crest height. That distinction is central: a river forecast may indicate danger, but a map can show whether that danger intersects a school, a hospital approach road, or a low-lying subdivision.
The newly added coverage areas underscore how broad the latest buildout has been. NOAA says recent expansion included the southeastern U.S. coast and Florida, the Great Lakes region, New England, the Rocky Mountains, the Dakotas, and western Nebraska. Importantly, the coverage is still not absolutely universal. Northern and western Alaska, Guam, the Northern Mariana Islands, and American Samoa remain outside the current near-complete footprint. Still, in practical terms, NOAA has moved flood inundation mapping from a partial pilot into something approaching a national operational expectation.
What the tool actually shows users
At its core, Flood Inundation Mapping estimates the extent of flooding based on model forecast river flows and current hydrologic conditions. NOAA describes it as a system that predicts where flooding impacts may occur in the coming days by estimating what land area is likely to be covered by water. That means users are not simply viewing rainfall totals or stream gauge readings; they are seeing a modeled flood footprint that attempts to translate river behavior into on-the-ground consequences.
The service is delivered through the National Water Prediction Service, the National Weather Service’s newer platform for water data and mapping. NOAA’s product materials indicate that users can turn on inundation layers alongside river gauges, hazards, precipitation, and other hydrologic information. In practical terms, this allows a person to move between broad situational awareness and more localized flood interpretation. A gauge may show a river rising toward major flood stage, while the inundation layer helps visualize the areas adjacent to that river that could be affected.
NOAA currently offers several versions of the service, and those distinctions matter. For the Lower 48 states and parts of south-central Alaska, four versions are available in near real time: National Water Model hourly analysis of current conditions, National Water Model five-day inundation forecast, National Weather Service River Forecast Center five-day inundation forecast, and static categorical Flood Inundation Mapping, often called CatFIM, for select river forecast points. In Hawaii, Puerto Rico, and the U.S. Virgin Islands, NOAA offers current-condition analysis, a 48-hour inundation forecast, and static categorical maps for select gauged locations.
Each version answers a slightly different question. The hourly analysis is closer to a present-tense depiction of flooding conditions inferred from modeled water flows and current data assimilation. The five-day outlook products are more forward-looking, helping users think about where water may spread over several forecast cycles. CatFIM, by contrast, is tied to flood categories at specific forecast points and can be useful for understanding what minor, moderate, or major flood stages may mean spatially at a known location. NOAA also notes that the service is available through GIS applications and multiple file types, making it usable not only by the public but also by local officials and technical analysts who need to incorporate flood extents into their own mapping workflows.
How ordinary users can use the map effectively
For the public, the most useful way to approach NOAA’s map is not as a single yes-or-no flood warning but as a layered decision aid. A homeowner, commuter, or caregiver should begin by locating the area of concern on the National Water Prediction Service map and then enabling relevant flood inundation layers. From there, the key task is comparison: compare the projected flood extent with roads, nearby streams, neighborhoods, and any critical destinations such as workplaces, schools, hospitals, or elder-care facilities. The map is most valuable when a user is asking a concrete question, such as whether access routes may be cut off or whether water is likely to approach a specific block.
Users also need to distinguish current depiction from forecast depiction. If the hourly analysis suggests water is already affecting nearby flood-prone land, that may support immediate protective action. If the five-day forecast shows expansion into a broader footprint, the map becomes a planning tool for staging vehicles, moving valuables, adjusting travel, or preparing evacuation support for vulnerable relatives. The greatest mistake would be to treat the map as either purely present-tense or purely speculative; it contains both immediate and anticipatory layers, and each should be interpreted in its own timeframe.
The map should also be used in conjunction with official warnings, not in place of them. NOAA labels the service experimental, which is an important signal that users should not interpret every shaded polygon as a certainty. Modeling has inherent limitations, especially in urban drainage environments, places with rapidly changing obstructions, or terrain where local conditions can alter how water spreads. The best use case is therefore corroborative: pair inundation layers with flood watches, warnings, river stage forecasts, local emergency management messaging, and if possible firsthand knowledge of vulnerable intersections or low-water crossings.
Another practical advantage is communication. A flood stage number can be difficult to explain to a family member, employee, or tenant; a map is easier to share and discuss. This is one reason the tool has gained traction among emergency managers. It allows users to move from abstract hazard awareness to visible consequence assessment. In many cases, the map may help residents decide earlier that “wait and see” is the wrong strategy, especially when even a small rise in water could isolate a property or make escape routes unreliable.
Real-world cases show why visualization changes decisions
NOAA and allied flood professionals have emphasized that the value of inundation mapping is not theoretical. National Weather Service offices have already used the tool in several emergency contexts where timing and location mattered as much as the forecast itself. In spring 2025, according to NOAA, the Weather Service office in Nashville used FIM to help provide a senior assisted living facility in Macon County, Tennessee with information needed to evacuate residents safely before floodwaters reached the site. That example is particularly instructive because vulnerable populations often require longer lead times and more confidence in impact estimates.
A second case came in April 2025, when the NWS office in Little Rock shared FIM with the city of Hardy, Arkansas. Local officials reportedly went door to door to evacuate residents, and the city later said it achieved a nearly 100% evacuation success rate. The importance of that episode lies in how a map supports operational specificity. Emergency workers do not simply need to know that a river is dangerous; they need to know which streets, homes, and access points warrant immediate attention. A visual inundation product can sharpen those priorities.
NOAA also cited the July 4-7, 2025 storm event in central Texas, when the Austin/San Antonio office distributed FIM to emergency management officials in Georgetown. That information reportedly helped authorities close roads and evacuate residents as storms rapidly developed. In January 2025, the Shreveport office used FIM in response to an imminent rise on the Glover River in Oklahoma, aiding evacuations before the river rose. And in April 2026, when the Muskegon River in Michigan reached major to record flooding, the Grand Rapids office used the tool as a critical awareness resource in places with little other detailed guidance.
Ken Graham, director of the National Weather Service, has called FIM a game changer in briefings for emergency managers, first responders, and communities. That assessment is persuasive because the case studies span different geographies and flood contexts: assisted living evacuation, door-to-door outreach, road closures, rural river response, and record flooding in areas with limited supplementary information. The pattern is clear. The map’s power lies less in replacing existing hydrologic forecasting than in making that forecasting operationally legible to the people who must act on it.
What the map still cannot do, and what comes next
For all its promise, NOAA’s flood map remains an experimental service, and that designation should shape public expectations. Experimental does not mean unusable; it means the product is still being refined and should be interpreted with care. Hydrologic and inundation modeling can estimate where water is likely to spread, but it cannot perfectly capture every local feature that influences flood behavior. Culverts, temporary debris, newly built structures, levee conditions, stormwater backups, and rapidly evolving rainfall patterns can all alter what happens on the ground.
There are also geographic and technical boundaries. Despite the new near-national reach, NOAA says the latest expansion still does not include northern and western portions of Alaska, Guam, the Northern Mariana Islands, and American Samoa. Product availability also differs by region. The Lower 48 and parts of south-central Alaska receive four near-real-time versions, while Hawaii, Puerto Rico, and the U.S. Virgin Islands currently receive a narrower menu that includes a 48-hour forecast rather than a five-day inundation forecast. For users, that means the experience is broader than before, but not perfectly uniform across the American map.
Even so, the direction of travel is unmistakable. NOAA’s earlier rollout of the National Water Prediction Service was explicitly designed to modernize how water information is delivered, combining observations, forecasts, GIS layers, and inundation tools in a more navigable interface. That reflects a larger shift in hazard communication: agencies are trying to show impacts rather than merely describe meteorological or hydrologic conditions. In flood risk, where public understanding often breaks down between a warning and a consequence, maps can close that gap.
The public takeaway is straightforward. NOAA’s expanded Flood Inundation Mapping is best understood as a decision-support tool that helps users ask better, more local questions before floodwater arrives. It will not eliminate uncertainty, and it should never be the sole basis for a life-safety choice. But by showing likely flood extent at neighborhood scale for nearly the entire U.S. population, it materially improves the nation’s ability to prepare. In flood emergencies, the difference between information and action is often visualization. NOAA’s map is increasingly designed to provide exactly that.